
Data Analysis of EPL 2017-2018 Season
Have you ever placed a bet on a football match? If you have, there is a high probability that you have lost. This post will help you increase your chance of winning.
First things first: Betting is bad –at least in my opinion. This post does not mean to encourage betting. Moreover, if you keep playing a game long enough, you will eventually end up losing. Therefore, you should know when to stop betting. The neural network I trained will tell you when.
There are various options in betting. In this work, I focused on the English Premier League (EPL) 2017-2018 season and the number of goals scored in an EPL match being over or under 2.5 (O2.5 and U2.5). The reason is simple: There are only 380 matches (38 for each team) in the league. This number is significantly low for a neural network to have an understanding of the data and make generalizations well enough to make accurate predictions for the unseen data –in fact, it is very low for any algorithm to make an accurate prediction. So, if we are already constrained by the amount of data, why try to predict an event with lots of outcomes?
The dataset I have used is taken from here. I have done some adjustments in terms of formatting and obtained this.
Matchday 1

Arsenal FC               4-3  Leicester City
Watford FC               3-3  Liverpool FC
Chelsea FC               2-3  Burnley FC
Crystal Palace           0-3  Huddersfield Town
Everton FC               1-0  Stoke City
Southampton FC           0-0  Swansea City
West Bromwich Albion     1-0  AFC Bournemouth
Brighton & Hove Albion   0-2  Manchester City
Newcastle United         0-2  Tottenham Hotspur
Manchester United        4-0  West Ham United
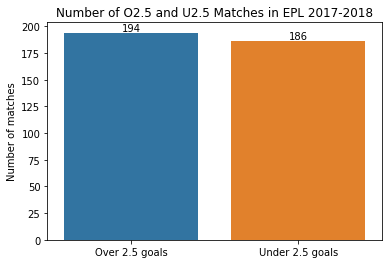
It is important for our dataset to be balanced. In other words, the number of O2.5 and U2.5 matches should be close in order for the neural network to generalize well. From the figure below, we can see that we have a somewhat balanced dataset. The numbers are not too far from each other. The network will tend to predict a match to be O2.5 though, because of the difference in the dataset. It would be better if we had a more balanced dataset, but this is what we have.
I think a nice skill to have for a data scientist or a deep learning engineer is to extract meaningful features from the data. In fact, this is the job of the neural network. But if you have an unvectorized data as you see above (just some text and numbers), you should vectorize it in a meaningful way for the neural network. Therefore, I had to extract meaningful features that will help to predict whether a match will be O2.5 or U2.5. Obvious features are: average number of goals scored/conceded at home/away games up to that week for both teams, average number of goals scored/conceded at last 5 (arbitrary number) matches for both teams. You can obviously use the performances of the players. For example, whether Mohamed Salah will play in the match or not, and his performance in the last 2 matches are obviously important for our task. However, I had no access to these data –I mean, technically I had access since there is something called the Internet, but it would give too little reward for too much work, so I did not include these data in my work.
In addition to the 6 features given above, we should take into account which teams are playing the match. Therefore, we identify the teams with 2 (one for the home team, one for the away team) one-hot-encoded vectors of length 20. The nice thing with this approach is that it takes into account the “Home” and “Away” concepts. Liverpool-Stoke City will probably have a different result than Stoke City-Liverpool in terms of O2.5/U2.5 (it is a cold rainy night).
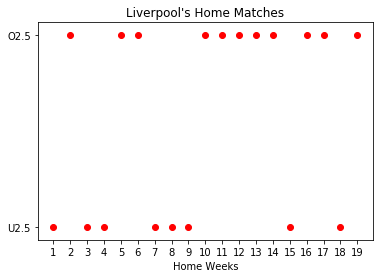
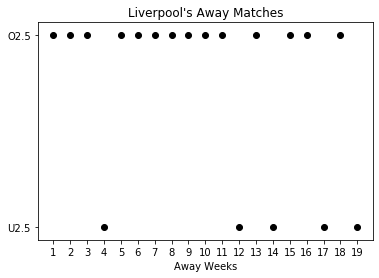
As it can be seen above, Liverpool’s home and away results are different in terms of O2.5/U2.5. This is the case in general. Home and away performances of the teams usually differ. In fact, home teams are thought to be advantegous generally.
In total, we have 380 samples and 52 features per sample. Since we are aware of the consequences of not splitting the dataset into training, validation and test sets; we split the dataset into training, validation and test sets. I discarded the matches played in the first 5 weeks since we have not enough information to make an accurate prediction. For the training, validation an test sets, I have used weeks 6-23, 24-30 and 31-38 respectively.
For the neural network, I have used RMSProp, binary cross-entropy and accuracy as optimizer, loss function and task metric. I have used the following architecture:
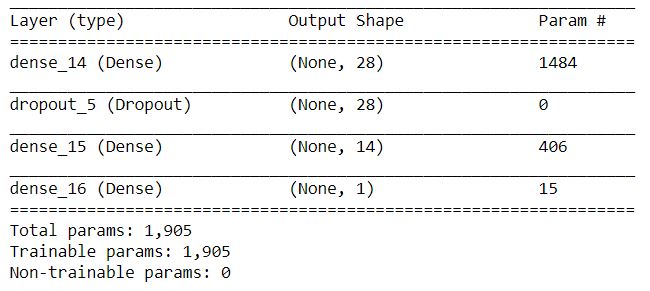
Since the data is tabular, I did not use convolutional neural networks or recurrent neural networks either. However, recurrent neural networks might be the correct architecture for this problem. The architecture I used is not necessarily the best one. The hyperparameters of the network can be tuned to achieve higher performance. We should also note that there may be no need to use a neural network for this task. Gradient boosting or random forest classifier might outperform the simple neural network I used in this work. I might try all of these setups and update this post in the future.
First, we take a look at the training and validation losses of the network.
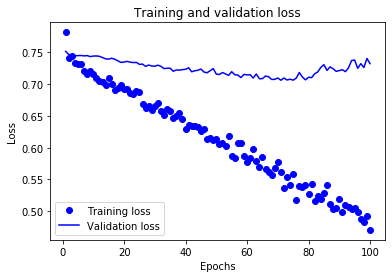
As we see, even though the training loss decreases monotonically, the validation loss stops decreasing at some point. This is a typical overfitting plot. Even though I have anticipated overfitting and tried to reduce it by using Dropout layers and L2 regularization, the amount of data we have is still low and not enough to fight overfitting.
The training and validation accuracies of the network can be seen below.
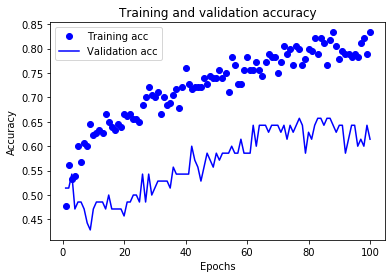
Because of the overfitting, the increase in the validation accuracy stops at some point.
From the plots above, we see that it is a nice idea to stop training after around 80 epochs. After modifying the number of epochs to train the network, we train the network again and obtain the following plots.
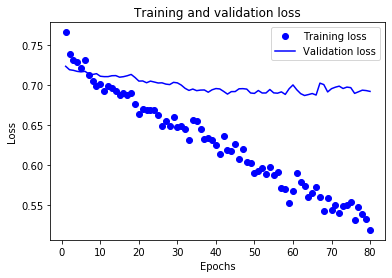
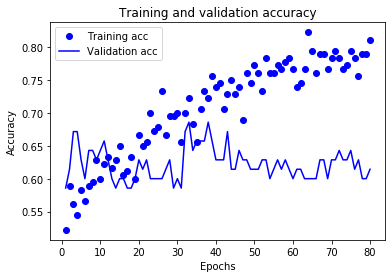
Looks much better. However, we should note there is a high variance in the performance due to the low amount of data. You are probably tired of reading “performance is not the best due to low amount of data” again and again but this is a common and serious issue in machine learning and deep learning. Since the dataset I am working on is naturally not rich in terms of number of samples, we can’t do much but pray. At this point may be you have thought “Why not use the previous seasons as well?” The reason we cannot do that is the league is dynamic. The teams playing in the league change, the players change, the coaches and the football tactics of the team change and so on. At the time of writing this post (Jan 16, 2020), Liverpool is dominating the league. If you use the 2010-2011 EPL season too in your dataset, you will get poor performance because the team was not as good as today.
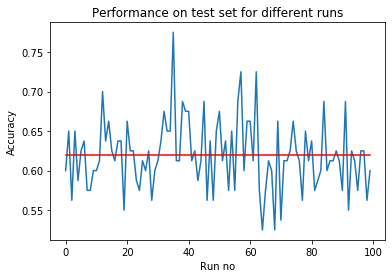
We evaluate our model in the test set: 8 weeks (80 matches). There will be high variance in the result since the number of samples in the test set is too low. Every time we run the whole code, we will get different results in the range 55-70%. To get a meaningful result, I have run the code 100 times and took the average. The performance in the test set is 62% as seen below. This is the best we can do with the current setup. Maybe one can use advanced techniques such as few-shot learning . Or the hyperparameters can be tuned.
So, we are now able to predict the result of a match (O2.5 or U2.5) with 62% accuracy. This is better than the “dumb” baseline 50%. Suppose you are betting on 3 matches and the probabilities of O2.5 and U2.5 are equal (this is roughly the case: 194 vs 186). If you are betting randomly, then you have a 12.5% chance of winning in total. However, you have ~24% chance if you use the model. Maybe your intuition performs better than this model, maybe not. What is certain is that you can use this approach while betting. It certainly gives you useful information.
If you want to apply this work to the current season, first you should have the dataset. However, since the current season is ongoing, you will have less data. You will not even have 380 matches. Therefore, your model will perform worse compared to this one. Nevertheless, it will give you higher chance of winning compared to a bet that does not use the model, since you are utilizing a neural network.
The source code of this work can be found here.